New electoral divisions have been set by Queensland’s Local Government Change Commission for Ipswich, which now has four divisions in total.
Ahead of the March 2020 local council election, Ipswich First will profile each of the divisions which will have two councillors representing each division after the election.
Each profile reports on data from the Australian Bureau of Statistics and .id the population experts.
The profiles provide a snapshot of community, workforce and household characteristics in each division compared to the city overall, and look at how local community characteristics have changed over the last two Census periods.
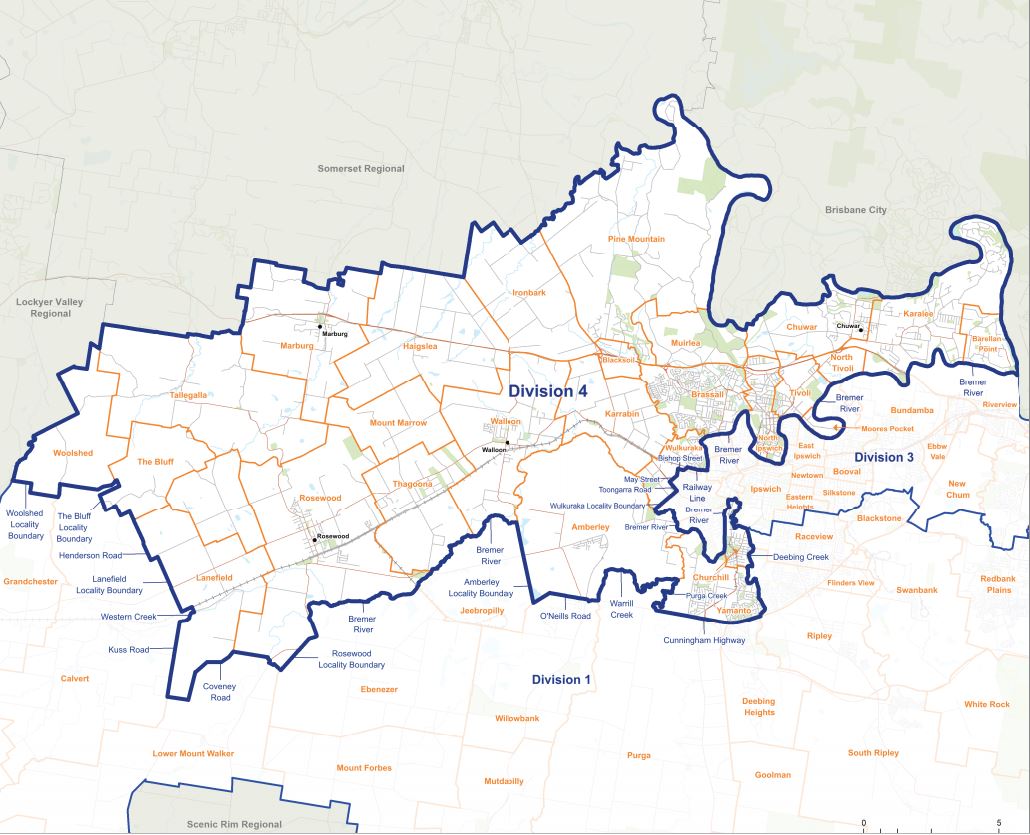
This is Division 4.

Division 4 amalgamates both rural and urban suburbs and contains areas with significant projected growth, such as Rosewood and Marburg.
In 2018, Division 4 had an estimated resident population of 47,003.
Over the twelve months to 2018, the estimated resident population increased by 1.9 per cent (below the 3.5 per cent population growth across Ipswich in the same period).
The division is oriented in a west-east direction mostly to the north of the Bremer River.
Division 4 suburbs
Woolshed
The Bluff
Ashwell
Lanefield
Rosewood
Tallegalla
Marburg
Mount Marrow
Thagoona
Walloon
Haigslea
Ironbark
Pine Mountain
Blacksoil
Karrabin
Amberley
Yamanto
Churchill
Brassall
Muirlea
North Ipswich
Tivoli
Moores Pocket
North Tivoli
Chuwar
Karalee
Barellan Point
Most of Wulkuraka that lies north of the railway line
The complete inclusion of Wulkuraka was not possible as each council division is required to have relatively the same number of electors.

Division 4 includes a range of well-established rural and urban areas of Ipswich.
The median age of Division 4 was older than the rest of Ipswich in 2016 (35 years compared to 32 years respectively).
The oldest suburb by median age in 2016 was Moores Pocket, at 61 years, influenced by the siting of two residential aged care facilities within the suburb.
Other suburbs with a median age over 50 years included Woolshed, Blacksoil and The Bluff, however these age averages are also likely to be influenced by small population numbers.
Division 4 suburbs with a young median age included Amberley (24 years), North Tivoli (25 years), Wulkaraka (27 years) and Mount Marrow (31 years).
Households in Pine Mountain and Karalee recorded the highest average household income in 2016 ($2,182 and $2,169 per week respectively), which was almost three times the average household income at Moores Pocket.
Almost three-quarters of Division 4 households are one-family households, slightly above Ipswich as a whole.
Of note, the division had a higher percentage of couples without children compared to Ipswich which can be a characteristic of households with older couples no longer with dependent children.
Since 2011, there has been a drop in the proportion of family households (from 75 per cent to 73 per cent) which may also be a characteristic of the older demographic.
In 2016, 4,974 people in Division 4 (11.3 per cent) were born overseas, which was a smaller proportion than for the City of Ipswich (20.1 per cent).
In Division 4, there were 1,891 residents (or 4.3 per cent) who identified as Aboriginal and/ or Torres Strait Islander peoples in 2016, which is similar to Ipswich as a whole (4.4 per cent)

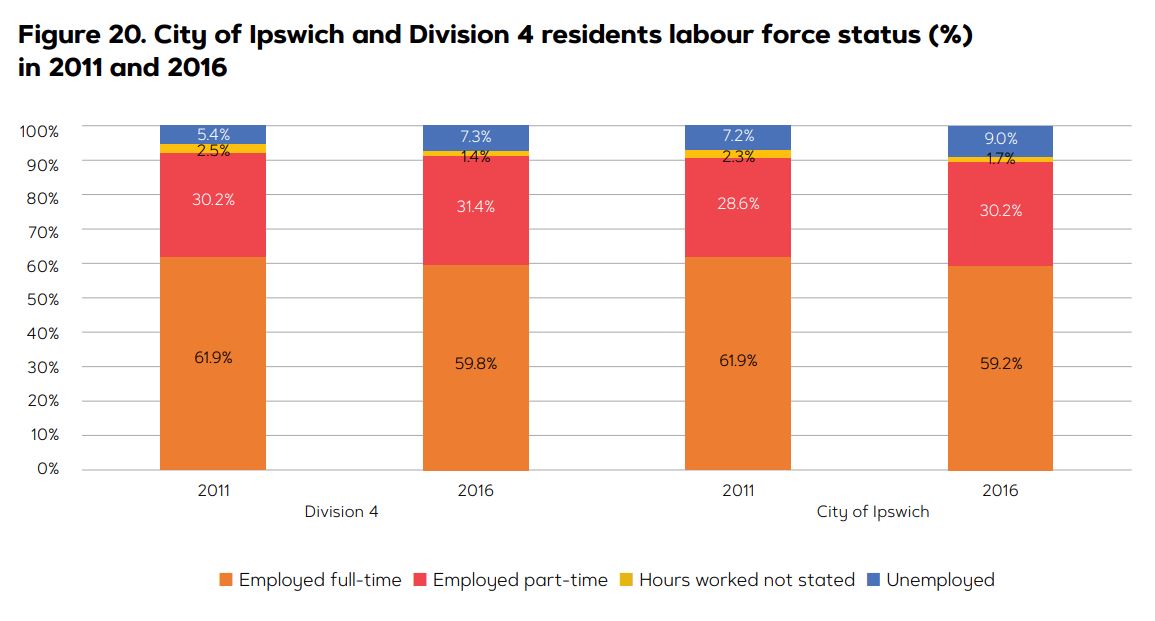
In 2016, there were 34,426 residents of working age in Division 4, including 21,370 (62.1 per cent) that participated in the labour force, comparable to Ipswich as a whole which had a participation rate of 62.6 per cent.
Of the Division 4 labour force:
- 12,773 people worked full-time (59.8 per cent down from 61.9 per cent in 2011)
- 6,719 people worked part-time (31.4 per cent up from 30.2 per cent in 2011)
- 1,569 were unemployed (7.3 per cent, up from 5.4 per cent in 2011)
The remaining 11,082 residents (or 32.2 per cent) aged 15 years and over who were not in the labour force stated they were either studying, performing home duties, had a disability or were neither studying nor working.
Three in five working residents from Division 4 are employed locally in Ipswich (8,913 people or 57.7 per cent) while nearly two in five travel outside of Ipswich for work (37.7 per cent or 5,824 people, well below the city’s average of 48.4 per cent).
The top 5 employment industries for working residents of Division 4 in 2016 were Health Care and Social Assistance (13.4 per cent); Public Administration and Safety (11 per cent), Retail Trade (10.6 per cent), Construction (9.1 per cent), and Education and Training (9 per cent).
Between 2011 and 2016, the most popular employment type in Division 4 changed from Manufacturing (dropping from 12.1 per cent of the employment share to 8.9 per cent) to Health Care and Social Assistance (increasing in employment share from 12.4 per cent to 13.4 per cent).
For workers based in Division 4, Retail Trade made up the largest employment share in 2016 (22.2 per cent) followed by Accommodation and Food Services (12.1 per cent) and Health Care and Social Assistance (11.1 per cent).
The three most popular occupations held by residents in Division 4 in 2016 were:
- Technicians and Trades Workers (3,247 people)
- Professionals (2,899 people)
- Clerical and Administrative Workers (2,873 people)

In 2016, there were 9,985 working residents in Division 4 earning more than $1,000 per week, which was a higher proportion than for the rest of Ipswich (29 per cent compared to 27.9 per cent).
Relative to Ipswich, Division 4 shows a greater proportion of working residents in the highest income quartile and a lesser proportion in the lowest income quartile.
Of Division 4 residents aged 15 years and over:
- 7,574 earn less than $333 weekly
- 7,909 earn $334 to $660 weekly
- 8,544 earn $661 to $1,195 weekly
- 7,375 earn $1,196 and over
In 2016, 62 per cent of households in Division 4 had purchased or fully owned their home while 27.3 per cent were renting privately and 2.4 per cent were in social housing in 2016.
Compared to Ipswich as a whole, Division 4 had a far higher rate of home ownership and lower proportion of rental both in private and social housing.
Since 2011, the proportion of private rental households has increased (from 24.6 per cent to 27.3 per cent) illustrating the higher levels of investor owned homes in the division.
View the full Divisional profiles here.


